
If you're running Facebook Ads for your eCommerce store, you are checking performance daily, just like 49.2% of advertisers do. And for good reason: real-time tracking helps you spot what’s working, fix what’s not, and make faster decisions.
But here’s the catch: manually creating reports and digging through metrics is time-consuming and leads to missed insights. In this blog, we’ll show you how to cut through the clutter and create Facebook Ads reports that are not just easy to generate, but actually actionable. With Graas, you can automate reporting, surface key trends instantly, and focus your energy on scaling what works.
Why Facebook Ads Reporting Matters for eCommerce
How to Create Facebook Ads Reports Manually
Smarter Way: Automate Facebook Ads Reporting with Graas
Benefits of Using Graas for Facebook Ads Reporting
Before we discuss how you can create Meta Advertising reports, we first need to understand why it matters:
Not all campaigns are created equal. Some only drive clicks, others drive cash. The key is knowing the difference.
Let’s say you're running three campaigns: one for prospecting, one for retargeting, and one for upselling. Your prospecting campaign might have a high click-through rate (CTR) of 4.2%, but it only brings in ₹50,000 in revenue. Meanwhile, your retargeting campaign with a lower CTR of 2.1% pulls in ₹2.3 lakhs.
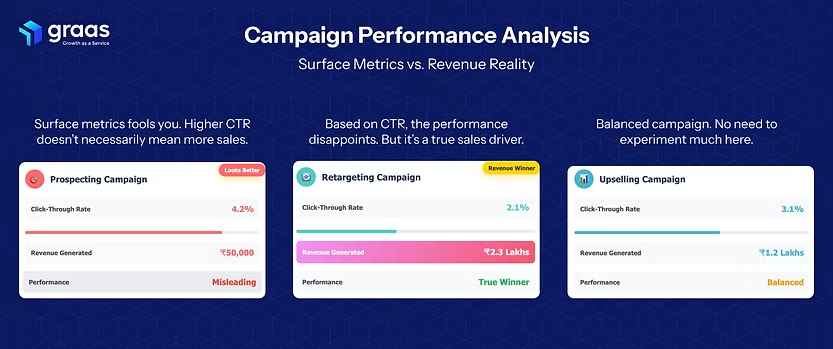
Without revenue-based reporting, you’d allocate more budget to what looks better on the surface. Facebook Ads reporting helps tie revenue directly to campaign performance, so you're scaling what actually converts, not just what gets clicks.
Effective ad spend isn't just about lowering your CPC; it’s about increasing your return on ad spend (ROAS).
Suppose your overall ROAS is 3.5x, but Campaign A is performing at 1.8x and Campaign B is hitting 6.2x. Without granular ROAS reporting, you'd average this out and miss the opportunity to pause underperforming ads and double down on winners.
Advanced reporting allows you to break down ROAS by ad set, placement, and even time of day, helping you reallocate budgets where returns are highest, sometimes improving efficiency by up to 40%.
The real power of reporting lies in spotting patterns. Your data might reveal that 75% of conversions from a “Summer Collection” campaign happen between 8–10 PM on mobile devices, with 68% from tier-1 cities.
Insights like these inform more precise targeting, smarter creative decisions, and tailored ad schedules. With trend tracking, you’re not just reacting to performance, you’re predicting what’s next. That’s the edge advanced eCommerce advertisers operate with.
In the Facebook Ads Manager dashboard, select the ad account you want to analyze.
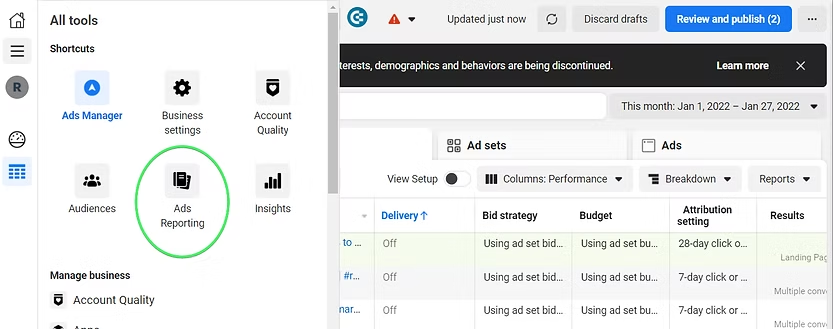
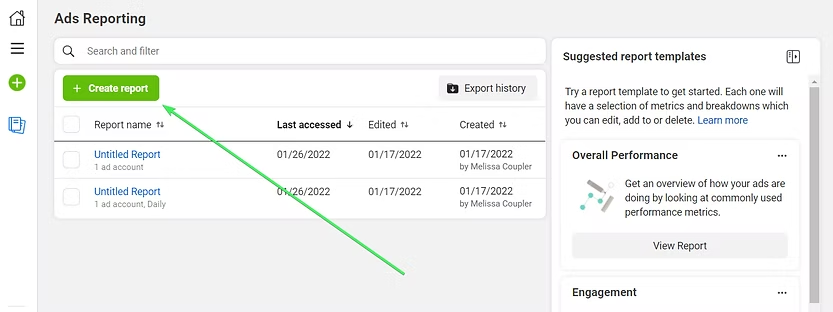
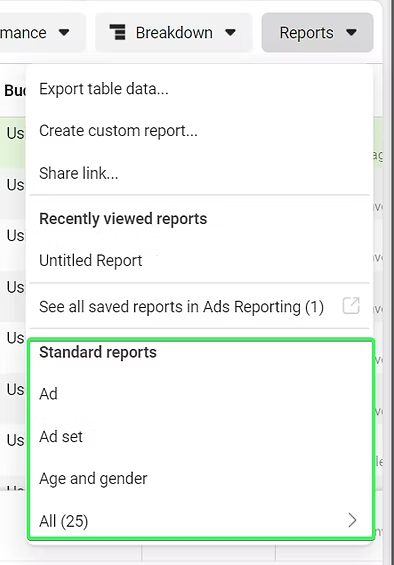
Click on the “Reporting” dropdown in the top-right corner, and either choose a saved report or click “Create Custom Report.” This is where you'll build your own view of performance.
Next, choose the metrics that matter for your analysis. Typical choices are CTR, CPC, ROAS, Cost per Purchase, and Revenue. But you’ll often need to go deeper. Think breakdowns by placement, age, device, or region. Each of these can add a layer of insight into what’s driving performance and where you're wasting spend.
Once metrics are selected, customize how the data is visualized. You can use pivot tables, bar charts, or trend lines to identify spikes, drops, or seasonal patterns. For example, a line chart comparing ROAS over the last 30 days may show your weekend performance outperforming weekdays, insights you might miss in raw tables.
After configuring the report, export it as a CSV or Excel file. This lets you do deeper comparisons, apply formulas, and build dashboards in Google Sheets or Excel. You might compare metrics across campaigns, months, or audiences manually, but it’s a slow, repetitive process.
Sounds all rosy, but it’s not. While manual reporting works, it comes with major downsides. Exporting and cleaning data takes time, requires Excel proficiency, and increases the risk of errors. If you’re running ads across Meta, Google, and marketplaces, you’ll need to repeat the same process for each platform. That quadruples the time it takes to get a complete picture, leaving less time for action and more room for misinterpretation.
There’s a smarter, faster, and more reliable way to get actionable insights from your Facebook Ads, without the manual grunt work. Meet Graas: an automated eCommerce analytics platform that eliminates errors, saves time, and gives you data you can actually act on.
Here’s how Graas' reporting transforms your ad analysis:
Tired of downloading CSVs and switching tabs? With Graas, you don’t have to. The platform integrates directly with Facebook Ads (and other major ad platforms like Google Ads, TikTok, and marketplaces), pulling data in real time.
That means no more waiting for exports or wrestling with pivot tables. All your campaign data (impressions, conversions, ROAS, and spend and more) is available in one unified view.
Plus, since Graas connects with every advertising channel, comparing Facebook Ads performance with your Google or TikTok campaigns takes seconds, not hours.
Graas’s eCommerce data centralization gives you a better sense of your performance. You can compare how your remarketing campaign on Facebook stacks up against your brand awareness push on Google.
What makes this powerful is Graas' access to your historical performance data. It uses that to contextualize results, highlight trends, and spot deviations. For example, if your Facebook ROAS is dipping below your 3-month average while Google is trending up, you’ll know it’s time to rebalance spend, without digging through spreadsheets.
Graas goes beyond reporting; it tells you what to do next. Its AI engine tracks patterns across your campaigns and automatically suggests optimizations. For example, it may recommend pausing underperforming ad sets or increasing spend during high-ROI time slots.
And mind you, these aren’t just generic tips. Graas bases them on predictive models that forecast outcomes. You’re no longer guessing which campaign to scale. You’re acting on data-backed projections, making your ad budget work harder and smarter.
With Graas, you don’t need to analyze Facebook in isolation. Its multi-channel integration lets you view and analyze campaigns across Facebook, Google, marketplaces, and more, all in one place.
Instead of exporting reports from each platform and trying to standardize the data manually, Graas does the heavy lifting. This gives you a clear, unified view of your entire ad ecosystem.
You can spot which campaign gives you the lowest CAC, and where to invest next. Compared to the manual approach, it's faster, more accurate, and infinitely more scalable.
When you’re managing multiple ad campaigns across platforms, time and clarity are everything. Graas streamlines your entire reporting workflow, so you can focus on strategy, not spreadsheets.
Forget juggling multiple logins, exporting CSVs, or building custom dashboards in Excel. Graas automates data collection, cleaning, and visualization. What used to take hours and days of manual effort can now be done in minutes, freeing up your team to focus on what actually moves the needle.
Graas gives you real-time performance insights at your fingertips. Instead of waiting for weekly reports or relying on instinct, you get instant access to the metrics that matter across campaigns, ad sets, and audiences. Whether you're scaling winners or cutting losses, you can make confident decisions in real-time.
By giving you a clearer picture of what's working and what’s not, Graas helps you optimize every ad spend. You’ll avoid wasted spend on low-impact campaigns, and spot opportunities for retargeting or upselling. The result? Higher returns without increasing your budget.
Graas combines all your marketing data, Facebook, Google, marketplaces, and more, into one intuitive dashboard. No more fragmented insights or inconsistent metrics. Plus, with built-in visualizations like trend graphs, funnel views, and performance comparisons, it’s easier to spot patterns and share insights with your team. And when you need to report to stakeholders, one-click exports make it effortless.
8 Craig Road, Singapore 089668
Email: info@graas.ai
Follow us on LinkedIn