
.webp)
The festive season in India can make or break your eCommerce business. The numbers tell a compelling story. India's total ad expenditure is projected to grow 7.8% in 2025, reaching ₹1,371 billion ($15.9 billion). Digital ad spending will surge 12–16%, hitting ₹580 billion this festive season, a record high for online advertising investments.
Consumer companies are increasing festive ad budgets by 15–20% after a tough first half. These campaigns now represent 30–40% of annual marketing spend for many brands. But here's the problem: marketers often get caught up in these impressive statistics and end up overspending or misallocating their budgets.
Why? They lack real, actionable insights.
The solution isn't throwing more money at ads. It's about strategic allocation between Meta and Google Ads based on data-driven decisions. This blog will show you exactly how to use marketing analytics to optimize your budget distribution and increase ROI during India's most crucial selling season.
Let’s dive right in!
When it comes to festive advertising in India, two platforms reign supreme. Their combined dominance is built on complementary strengths that cover every stage of the customer journey.
Meta powers a majority of all retargeting conversions during festive seasons. Facebook and Instagram excel at visual storytelling, making them perfect for showcasing festive product collections and seasonal offers.
The platform's strength lies in nurturing potential customers through custom audiences and lookalike targeting. Meta's sophisticated retargeting capabilities bring back high-intent shoppers who browsed but didn't convert, creating multiple touchpoints throughout the extended festive buying cycle.
Google accounts for nearly 50% of India's total paid ad conversions, positioning it as the go-to platform for bottom-funnel activities. When customers search for "Diwali gifts under 5000" or "festive wear online," Google Search Ads capture this high-intent traffic.
Google Shopping campaigns show products with prices and reviews directly in search results, while YouTube ads leverage India's massive video consumption habits. The platform excels at converting users who already know what they want, making it essential for transaction-focused campaigns.
Both platforms now account for the largest share of Indian digital ad budgets; social media (Meta) represents 23%, while search (Google) captures 18% of total digital ad spend in 2025. This distribution reflects their complementary roles: Meta drives awareness and consideration, while Google captures demand and converts intent into sales.
Despite having access to powerful eCommerce analytics platforms, most marketers still make budget allocation decisions based on gut feeling rather than hard data. This approach costs brands millions in wasted spend and missed opportunities during the festive rush.
Research shows that 30% of marketers still choose platforms based on bias rather than campaign metrics.
Some digital marketing teams favor Google Ads because they're comfortable with keyword research and search campaigns. Others lean heavily toward Meta because they understand creative testing and audience segmentation better.
This preference-driven approach ignores the fundamental question: which platform delivers better results for specific campaign objectives? Personal comfort with a platform's interface shouldn't determine where you invest your festive budget.
Many brands fall into the trap of over-relying on either Google Search Ads or Meta Conversion campaigns without comparing cross-platform performance. Google Search often becomes the default choice for direct response campaigns, while Meta gets pigeonholed for brand awareness.
This siloed thinking prevents marketers from discovering that Meta might actually drive better cost-per-acquisition for certain product categories, or that Google Display could outperform Facebook for specific audience segments. Campaign-level testing across both platforms reveals surprising performance differences that bias-driven decisions miss entirely.
Without unified insights from both platforms, you can't determine which channel delivers higher returns on ad spend. Most marketing teams analyze Google and Meta performance in separate dashboards, making it impossible to compare true efficiency metrics. This fragmented view leads to budget allocation based on incomplete data, often favoring the platform that reports better vanity metrics rather than actual business impact.
Smart budget allocation starts with tracking the right performance indicators across both platforms. Here are the essential metrics that reveal which platform delivers better value for your festive campaigns.
CPC varies dramatically between platforms due to different auction dynamics and competition levels. Meta's CPC remains relatively low because of its vast inventory and targeting precision, while Google Search commands premium pricing for high-intent keywords. CPA tells the complete story by factoring in conversion rates; a higher CPC might still deliver a lower CPA if conversion rates are stronger.
%20and%20Cost%20Per%20Acquisition%20(CPA)%20.webp)
CTR indicates how compelling your creative and targeting are to your audience. Google Search typically shows higher CTRs because users are actively searching for solutions, while Meta requires more engaging visuals to capture attention in a social environment.
Conversion rates reveal platform effectiveness at turning clicks into customers, with Google often showing stronger rates for transactional campaigns.
%20and%20Conversion%20Rate%20by%20Platform.webp)
ROAS is your ultimate performance benchmark across Facebook, Instagram, Google Search, and YouTube. Each placement has different strengths. Instagram excels for lifestyle products, Google Search for immediate purchase intent, and YouTube for discovery-driven categories like electronics and fashion.
%20Analysis.webp)
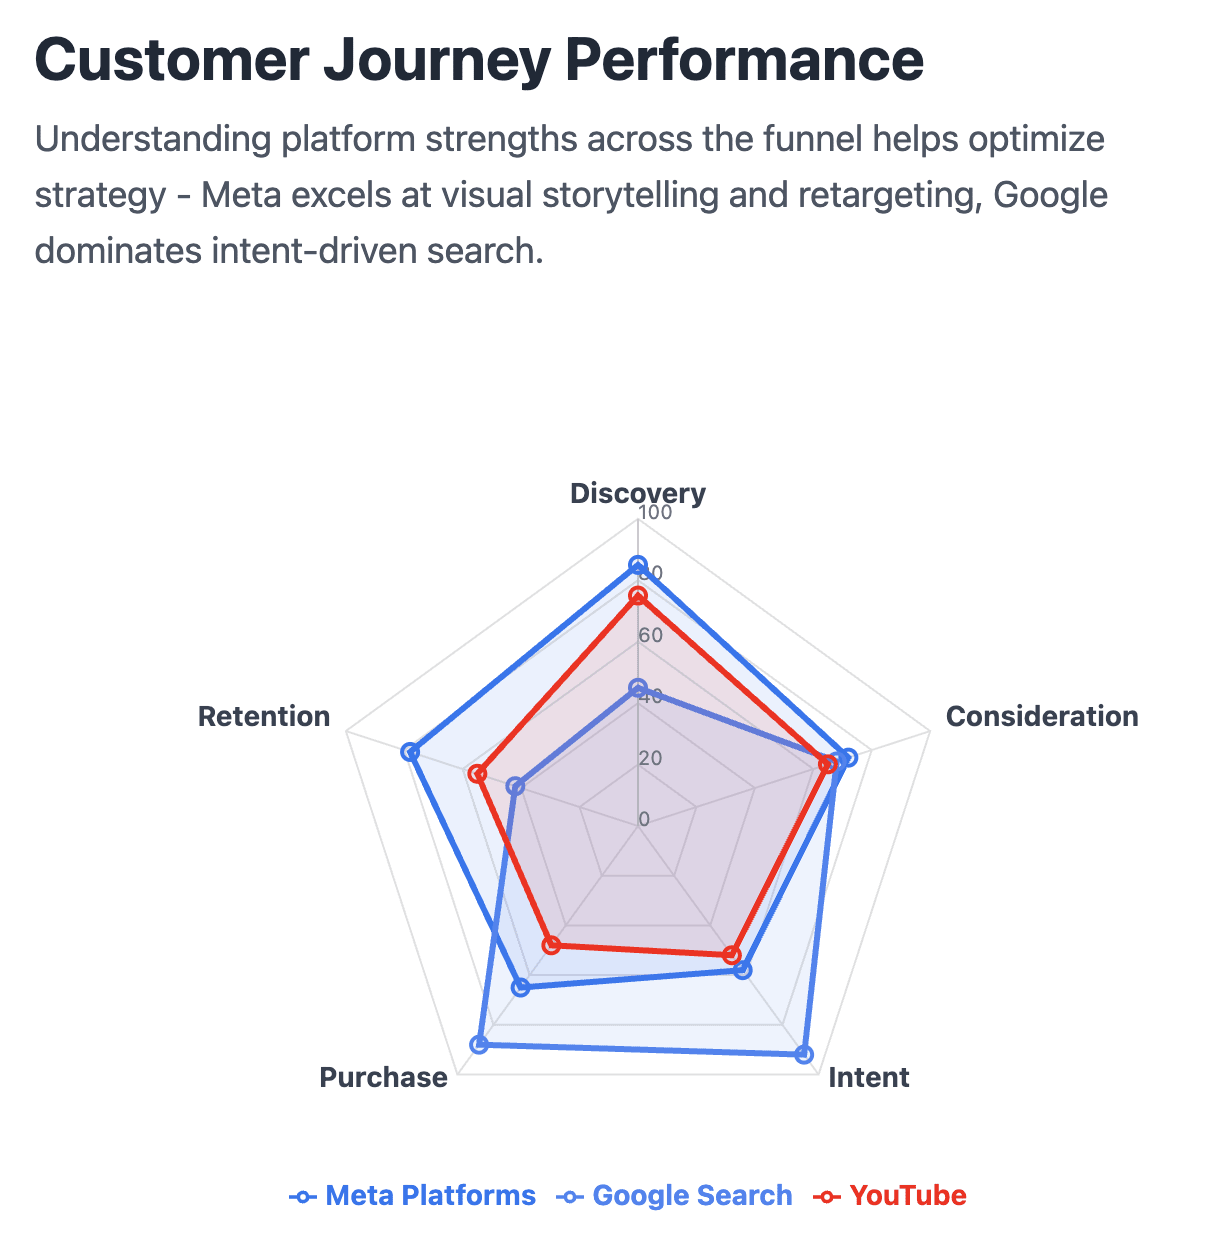
Understanding who converts faster and where helps optimize your funnel strategy. Meta's strong suit lies in retargeting, making it excellent for high-impact mid-funnel and bottom-funnel conversions. Google's forte is bottom-funnel, intent-driven search, plus mass reach via YouTube for discovery-to-purchase journeys.
Graas' eCommerce analytics platform removes the guesswork from festive budget allocation by bringing all your marketing and advertising data into a single, comprehensive dashboard.
Instead of juggling multiple tabs and spreadsheets, you get complete visibility into cross-platform performance that drives smarter spending decisions.
The platform consolidates ad spend, conversions, and ROAS from both Meta and Google Ads in one centralized view. You can instantly see how your Facebook campaigns compare against Google Search ads without switching between different interfaces or manually compiling reports.
This unified approach reveals performance patterns that are impossible to spot when data lives in separate silos. The dashboard updates in real-time, giving you accurate performance snapshots that reflect current campaign status rather than outdated metrics from yesterday's reports.
Graas enables instant comparison of which products or campaigns performed best by platform for each stage of the customer journey. You can identify whether your awareness campaigns work better on Instagram or YouTube, and determine if Google Shopping outperforms Facebook Dynamic Ads for your specific product categories.
The platform maps campaign performance to different funnel stages, showing you exactly where each platform delivers maximum impact. This granular analysis helps you allocate budgets based on actual performance rather than assumptions about platform strengths.
During peak festive periods, campaign performance can shift rapidly due to increased competition and changing consumer behavior. Graas tracks costs and returns continuously, allowing you to adjust budget allocations on the fly for ROI-maximizing results.
The platform alerts when campaigns exceed cost thresholds or fall below performance benchmarks, enabling immediate optimization. You can pause underperforming campaigns and scale winning ones without waiting for end-of-day reports or weekly reviews.
Use Graas to improve festive campaign ROI with cross-platform visibility that turns data into actionable insights.

eCommerce in 2026: From AI Insights to AI Execution
Read more
From Alerts to Actions: What Agentic Systems Actually Do in eCommerce
Read more
From Chatbots to Agentic Commerce: The Next Step for Retail AI
Read more
Agentic Commerce: Redefining Retail Profitability
Read more
From Questions to Charts: Writing Better Prompts for eCommerce Reporting
Read moreThe festive season in India can make or break your eCommerce business. The numbers tell a compelling story. India's total ad expenditure is projected to grow 7.8% in 2025, reaching ₹1,371 billion ($15.9 billion). Digital ad spending will surge 12–16%, hitting ₹580 billion this festive season, a record high for online advertising investments.
Consumer companies are increasing festive ad budgets by 15–20% after a tough first half. These campaigns now represent 30–40% of annual marketing spend for many brands. But here's the problem: marketers often get caught up in these impressive statistics and end up overspending or misallocating their budgets.
Why? They lack real, actionable insights.
The solution isn't throwing more money at ads. It's about strategic allocation between Meta and Google Ads based on data-driven decisions. This blog will show you exactly how to use marketing analytics to optimize your budget distribution and increase ROI during India's most crucial selling season.
Let’s dive right in!
When it comes to festive advertising in India, two platforms reign supreme. Their combined dominance is built on complementary strengths that cover every stage of the customer journey.
Meta powers a majority of all retargeting conversions during festive seasons. Facebook and Instagram excel at visual storytelling, making them perfect for showcasing festive product collections and seasonal offers.
The platform's strength lies in nurturing potential customers through custom audiences and lookalike targeting. Meta's sophisticated retargeting capabilities bring back high-intent shoppers who browsed but didn't convert, creating multiple touchpoints throughout the extended festive buying cycle.
Google accounts for nearly 50% of India's total paid ad conversions, positioning it as the go-to platform for bottom-funnel activities. When customers search for "Diwali gifts under 5000" or "festive wear online," Google Search Ads capture this high-intent traffic.
Google Shopping campaigns show products with prices and reviews directly in search results, while YouTube ads leverage India's massive video consumption habits. The platform excels at converting users who already know what they want, making it essential for transaction-focused campaigns.
Both platforms now account for the largest share of Indian digital ad budgets; social media (Meta) represents 23%, while search (Google) captures 18% of total digital ad spend in 2025. This distribution reflects their complementary roles: Meta drives awareness and consideration, while Google captures demand and converts intent into sales.
Despite having access to powerful eCommerce analytics platforms, most marketers still make budget allocation decisions based on gut feeling rather than hard data. This approach costs brands millions in wasted spend and missed opportunities during the festive rush.
Research shows that 30% of marketers still choose platforms based on bias rather than campaign metrics.
Some digital marketing teams favor Google Ads because they're comfortable with keyword research and search campaigns. Others lean heavily toward Meta because they understand creative testing and audience segmentation better.
This preference-driven approach ignores the fundamental question: which platform delivers better results for specific campaign objectives? Personal comfort with a platform's interface shouldn't determine where you invest your festive budget.
Many brands fall into the trap of over-relying on either Google Search Ads or Meta Conversion campaigns without comparing cross-platform performance. Google Search often becomes the default choice for direct response campaigns, while Meta gets pigeonholed for brand awareness.
This siloed thinking prevents marketers from discovering that Meta might actually drive better cost-per-acquisition for certain product categories, or that Google Display could outperform Facebook for specific audience segments. Campaign-level testing across both platforms reveals surprising performance differences that bias-driven decisions miss entirely.
Without unified insights from both platforms, you can't determine which channel delivers higher returns on ad spend. Most marketing teams analyze Google and Meta performance in separate dashboards, making it impossible to compare true efficiency metrics. This fragmented view leads to budget allocation based on incomplete data, often favoring the platform that reports better vanity metrics rather than actual business impact.
Smart budget allocation starts with tracking the right performance indicators across both platforms. Here are the essential metrics that reveal which platform delivers better value for your festive campaigns.
CPC varies dramatically between platforms due to different auction dynamics and competition levels. Meta's CPC remains relatively low because of its vast inventory and targeting precision, while Google Search commands premium pricing for high-intent keywords. CPA tells the complete story by factoring in conversion rates; a higher CPC might still deliver a lower CPA if conversion rates are stronger.
CTR indicates how compelling your creative and targeting are to your audience. Google Search typically shows higher CTRs because users are actively searching for solutions, while Meta requires more engaging visuals to capture attention in a social environment.
Conversion rates reveal platform effectiveness at turning clicks into customers, with Google often showing stronger rates for transactional campaigns.
ROAS is your ultimate performance benchmark across Facebook, Instagram, Google Search, and YouTube. Each placement has different strengths. Instagram excels for lifestyle products, Google Search for immediate purchase intent, and YouTube for discovery-driven categories like electronics and fashion.
Understanding who converts faster and where helps optimize your funnel strategy. Meta's strong suit lies in retargeting, making it excellent for high-impact mid-funnel and bottom-funnel conversions. Google's forte is bottom-funnel, intent-driven search, plus mass reach via YouTube for discovery-to-purchase journeys.
Graas' eCommerce analytics platform removes the guesswork from festive budget allocation by bringing all your marketing and advertising data into a single, comprehensive dashboard.
Instead of juggling multiple tabs and spreadsheets, you get complete visibility into cross-platform performance that drives smarter spending decisions.
The platform consolidates ad spend, conversions, and ROAS from both Meta and Google Ads in one centralized view. You can instantly see how your Facebook campaigns compare against Google Search ads without switching between different interfaces or manually compiling reports.
This unified approach reveals performance patterns that are impossible to spot when data lives in separate silos. The dashboard updates in real-time, giving you accurate performance snapshots that reflect current campaign status rather than outdated metrics from yesterday's reports.
Graas enables instant comparison of which products or campaigns performed best by platform for each stage of the customer journey. You can identify whether your awareness campaigns work better on Instagram or YouTube, and determine if Google Shopping outperforms Facebook Dynamic Ads for your specific product categories.
The platform maps campaign performance to different funnel stages, showing you exactly where each platform delivers maximum impact. This granular analysis helps you allocate budgets based on actual performance rather than assumptions about platform strengths.
During peak festive periods, campaign performance can shift rapidly due to increased competition and changing consumer behavior. Graas tracks costs and returns continuously, allowing you to adjust budget allocations on the fly for ROI-maximizing results.
The platform alerts when campaigns exceed cost thresholds or fall below performance benchmarks, enabling immediate optimization. You can pause underperforming campaigns and scale winning ones without waiting for end-of-day reports or weekly reviews.
Use Graas to improve festive campaign ROI with cross-platform visibility that turns data into actionable insights.
8 Craig Road, Singapore 089668
Email: info@graas.ai
Follow us on LinkedIn