

Struggling with spreadsheets for keeping track of your online store's numbers? Well, it can be a pain — keeping track of data and visualizing is a hassle and it's easy to mess things up.
Plus, with all those spreadsheets flying around, it's hard to know what's true. There's a better way!
Graas makes eCommerce data analysis easy. A simple, customizable dashboard that shows you everything you need to know in one place, with clear charts and graphs.
Graas gives you real-time info on your eCommerce business at your fingertips so you can make smarter decisions and boost your sales.
Let's see why you should not be using spreadsheets for eCommerce analytics, and then we’ll discuss how Graas can help!
In eCommerce, data is fragmented across multiple sales channels and marketplaces, and spreadsheets have become a go-to solution for consolidating and analyzing this disparate information.
At first glance, spreadsheets may seem like a cost-effective option for data analytics, but their lack of automation and advanced capabilities can quickly become a bottleneck as your eCommerce business scales and grows.
One significant limitation of spreadsheets is the lack of customization and flexibility. While you can create basic charts and visualizations, these tools are often one-size-fits-all, failing to adapt to the unique needs and nuances of your eCommerce operations.
As a result, you may find yourself trying to fit a square peg into a round hole, compromising the clarity and effectiveness of your eCommerce data analysis.
Moreover, even if you manage to overcome the customization problem, the data itself may not tell a cohesive story. Different sales platforms and marketplaces often calculate and define metrics differently.
For example, one platform may consider an "order" as the point of purchase, while another may count an order only after it's been delivered—and yet another might factor in returns when calculating total orders for a given period.
This inconsistency in metric definitions can lead to confusion, inaccuracies, and an incomplete picture of your eCommerce performance.
Relying solely on spreadsheets for eCommerce analytics is a suboptimal approach that can hinder your ability to make informed, data-driven decisions.
You need a better, smarter, and more efficient way of analyzing your data—one tailored specifically to your business needs and the challenges of eCommerce. This is where dedicated eCommerce analytics solutions like Graas come in.
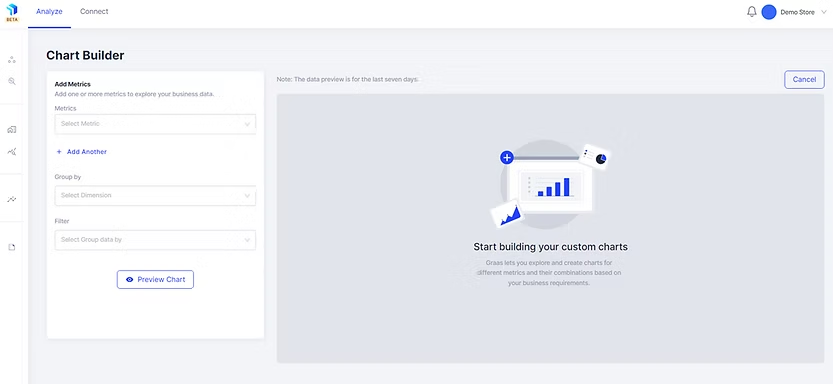
Custom dashboards are one of the most prominent aspects of Graas. You don’t have to struggle with endless spreadsheets and confusing formulas.
With Graas, you design dashboards that display the information that matters most to you and your business. This means no more time wasted digging through data—you'll have everything you need at a glance.
Here's how Graas custom dashboards can transform your eCommerce analytics:
With Graas, you can create dashboards that track key metrics of the eCommerce equation like website traffic, conversion rates, and AOV in real time. See which products are flying off the shelves. And also identify the ones that need a boost. It allows you to find out trends in customer behavior and adapt your marketing strategies accordingly.
Let’s say you own an online sporting goods store and create a Graas dashboard to track sales by product category. You might notice a surge in demand for running shoes as a marathon approaches. Based on this information, you can quickly decide to stock up on popular running shoe brands and advertise targeted promotions. This will help you maximize your sales during the peak season.
Graas isn't just about creating visually appealing dashboards. It allows you to become a true data detective, finding hidden insights within your eCommerce data.
You get to decide exactly which data points you want to visualize. Wondering how traffic sources like social media ads stack up against organic search in driving sales? Absolutely! Curious about how conversion rates differ across various product categories? Effortlessly create a chart to reveal those insights. This level of control lets you dive deep into the specifics and pinpoint root causes and areas for improvement.
For example, consider you run an online furniture store and suspect mobile traffic might be converting at a lower rate than desktop visitors. With a Graas custom dashboard, you can create a chart that plots conversion rates against device type (mobile vs. desktop). The data confirms your suspicion—mobile conversions are lagging. With this knowledge, you can focus on optimizing your mobile store experience and marketing campaigns to improve conversions on that platform.
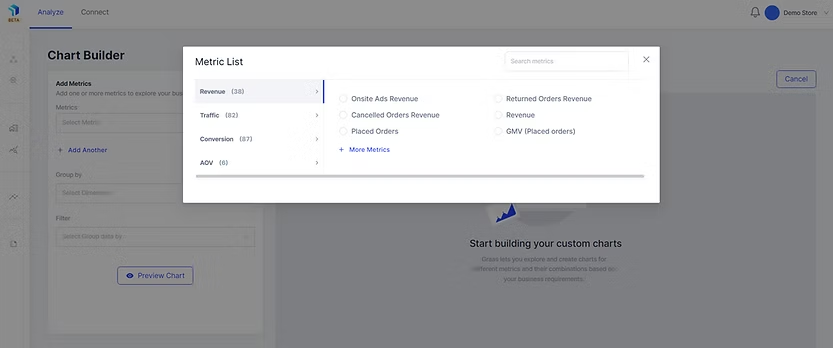
Now, this is just scratching the surface. You can explore a vast array of metrics—34 revenue metrics, a whopping 82 traffic metrics, 88 conversion rate metrics, and 5 average order value metrics—to create your dashboards to your specific needs.
Whether you want to track customer acquisition costs, analyze marketing campaign effectiveness, or identify top-performing product categories, Graas's custom dashboard allows you to transform raw data into actionable insights.
With Graas’ intuitive interface, you can group your data by various factors, giving you access to deeper trends and patterns that might otherwise remain hidden.
It allows you to segment your data by source, stores, geo-location, or even customer demographics—all within a single, customizable dashboard.
Let's revisit our furniture store example. Using your Graas dashboard, you've confirmed the conversion rate disparity between mobile and desktop users.
But what if you could dig even deeper? By grouping your data by traffic source within the mobile category, you might discover that social media ads on mobile convert at a significantly lower rate compared to organic search traffic. This newfound insight allows you to refine your mobile marketing strategy. You can direct your resources towards channels that drive higher conversions.
Perhaps you’re selling with the highest conversion rate on Amazon, while on Lazada, conversion consistently lags behind. Graas lets you compare performance across all your stores, helping you identify areas for improvement and implement targeted strategies to boost conversions in underperforming locations.
Geo-location allows you to identify a surge in sales for a particular product line in a specific region. This knowledge allows you to create your marketing campaigns and product offerings to cater to regional preferences, maximizing sales opportunities.
You can group your data by various other factors, including customer demographics, purchase history, and product categories. Analyzing your eCommerce data at such a granular level almost guarantees success.
Remember the frustration of filtering data in spreadsheets? Endless formulas, complex criteria, and the constant risk of errors—these are just some of the headaches Graas eliminates.
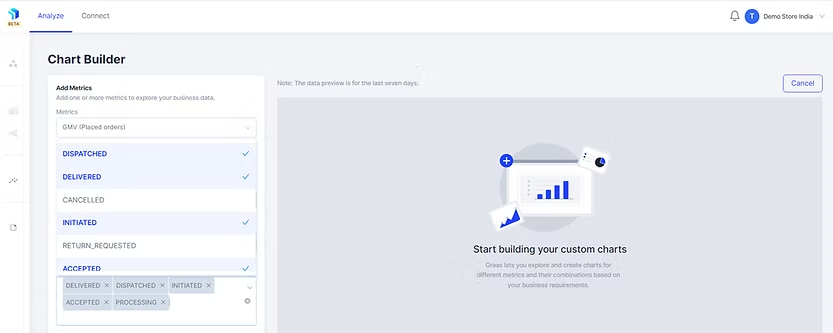
You’ll be able to sift and filter through heaps of data by specific values in seconds, isolating precisely what you need. Need to calculate the true Gross Merchandise Value (GMV) excluding returned and canceled orders? No problem! Simply filter your data by order status, selecting values like "Delivered," "Dispatched," "Accepted," and "Processing." Graas instantly displays the accurate GMV, saving you hours of tedious work and the potential for errors.
Let's say you want to analyze marketing campaign performance but only for a specific product category. Graas lets you filter your data by both campaign and product category, allowing you to pinpoint the effectiveness of each campaign for different product lines.
Graas allows you to present that data in the format that best suits your needs. It’s a platform filled with different chart types, each offering a unique perspective on your data. You get the ability to preview your chart in various formats like stacked bars, lines, trees, pies, tables, and cards, before selecting the one that delivers the most impactful insights.
Here are the view options available:
With a vast range of chart formats at your disposal, you have the flexibility to build your dashboards to present your data in the most insightful and visually compelling way possible. This allows you to communicate complex information to your team.
Remember the endless email chains and conflicting versions floating around when collaborating on spreadsheets? Graas eliminates this chaos, fostering seamless data sharing and collaboration within your team.
Sure, spreadsheets might be a viable option if you have a limited dataset and just a handful of employees. But as your business grows, so do the complexities of data sharing. Graas steps in as the perfect solution.
With Graas, everyone on your team can access the latest, most accurate data—all in one centralized location. You can create beautiful, informative dashboards within minutes and share them with your colleagues with just a few clicks. Simply give them access levels based on their needs, ensuring data security and preventing unauthorized edits.
The best part? Any changes made to the underlying data are reflected in real time across all shared dashboards. This eliminates confusion and ensures everyone is working with the same information. No more wasted time consolidating data or chasing down the "correct" spreadsheet version.
Stop feeling overwhelmed by spreadsheets and use your eCommerce data to its true potential with Graas custom dashboards. They make your eCommerce data analysis effortless and give clear and actionable insights. The best part is how easily you can collaborate with your team.
Graas offers the flexibility you crave:
Stop settling for spreadsheets. Sell more with Graas custom dashboards. Try our product today!

From Questions to Charts: Writing Better Prompts for eCommerce Reporting
อ่านบทความ
Interpreting ROAS drops in Meta, Google, and Marketplaces
อ่านบทความ
Practical AI Prompts for Analyzing eCommerce Data
อ่านบทความ
AI Prompts to Analyze CNY and Raya/Ramadan eCommerce Performance
อ่านบทความ
แบรนด์อีคอมเมิร์ซยอดนิยมเติบโตอย่างไรแม้จะไม่มีกิจกรรมขายมากมายบน Amazon, Flipkart, Myntra และ D2C
อ่านบทความStruggling with spreadsheets for keeping track of your online store's numbers? Well, it can be a pain — keeping track of data and visualizing is a hassle and it's easy to mess things up.
Plus, with all those spreadsheets flying around, it's hard to know what's true. There's a better way!
Graas makes eCommerce data analysis easy. A simple, customizable dashboard that shows you everything you need to know in one place, with clear charts and graphs.
Graas gives you real-time info on your eCommerce business at your fingertips so you can make smarter decisions and boost your sales.
Let's see why you should not be using spreadsheets for eCommerce analytics, and then we’ll discuss how Graas can help!
In eCommerce, data is fragmented across multiple sales channels and marketplaces, and spreadsheets have become a go-to solution for consolidating and analyzing this disparate information.
At first glance, spreadsheets may seem like a cost-effective option for data analytics, but their lack of automation and advanced capabilities can quickly become a bottleneck as your eCommerce business scales and grows.
One significant limitation of spreadsheets is the lack of customization and flexibility. While you can create basic charts and visualizations, these tools are often one-size-fits-all, failing to adapt to the unique needs and nuances of your eCommerce operations.
As a result, you may find yourself trying to fit a square peg into a round hole, compromising the clarity and effectiveness of your eCommerce data analysis.
Moreover, even if you manage to overcome the customization problem, the data itself may not tell a cohesive story. Different sales platforms and marketplaces often calculate and define metrics differently.
For example, one platform may consider an "order" as the point of purchase, while another may count an order only after it's been delivered—and yet another might factor in returns when calculating total orders for a given period.
This inconsistency in metric definitions can lead to confusion, inaccuracies, and an incomplete picture of your eCommerce performance.
Relying solely on spreadsheets for eCommerce analytics is a suboptimal approach that can hinder your ability to make informed, data-driven decisions.
You need a better, smarter, and more efficient way of analyzing your data—one tailored specifically to your business needs and the challenges of eCommerce. This is where dedicated eCommerce analytics solutions like Graas come in.
Custom dashboards are one of the most prominent aspects of Graas. You don’t have to struggle with endless spreadsheets and confusing formulas.
With Graas, you design dashboards that display the information that matters most to you and your business. This means no more time wasted digging through data—you'll have everything you need at a glance.
Here's how Graas custom dashboards can transform your eCommerce analytics:
With Graas, you can create dashboards that track key metrics of the eCommerce equation like website traffic, conversion rates, and AOV in real time. See which products are flying off the shelves. And also identify the ones that need a boost. It allows you to find out trends in customer behavior and adapt your marketing strategies accordingly.
Let’s say you own an online sporting goods store and create a Graas dashboard to track sales by product category. You might notice a surge in demand for running shoes as a marathon approaches. Based on this information, you can quickly decide to stock up on popular running shoe brands and advertise targeted promotions. This will help you maximize your sales during the peak season.
Graas isn't just about creating visually appealing dashboards. It allows you to become a true data detective, finding hidden insights within your eCommerce data.
You get to decide exactly which data points you want to visualize. Wondering how traffic sources like social media ads stack up against organic search in driving sales? Absolutely! Curious about how conversion rates differ across various product categories? Effortlessly create a chart to reveal those insights. This level of control lets you dive deep into the specifics and pinpoint root causes and areas for improvement.
For example, consider you run an online furniture store and suspect mobile traffic might be converting at a lower rate than desktop visitors. With a Graas custom dashboard, you can create a chart that plots conversion rates against device type (mobile vs. desktop). The data confirms your suspicion—mobile conversions are lagging. With this knowledge, you can focus on optimizing your mobile store experience and marketing campaigns to improve conversions on that platform.
Now, this is just scratching the surface. You can explore a vast array of metrics—34 revenue metrics, a whopping 82 traffic metrics, 88 conversion rate metrics, and 5 average order value metrics—to create your dashboards to your specific needs.
Whether you want to track customer acquisition costs, analyze marketing campaign effectiveness, or identify top-performing product categories, Graas's custom dashboard allows you to transform raw data into actionable insights.
With Graas’ intuitive interface, you can group your data by various factors, giving you access to deeper trends and patterns that might otherwise remain hidden.
It allows you to segment your data by source, stores, geo-location, or even customer demographics—all within a single, customizable dashboard.
Let's revisit our furniture store example. Using your Graas dashboard, you've confirmed the conversion rate disparity between mobile and desktop users.
But what if you could dig even deeper? By grouping your data by traffic source within the mobile category, you might discover that social media ads on mobile convert at a significantly lower rate compared to organic search traffic. This newfound insight allows you to refine your mobile marketing strategy. You can direct your resources towards channels that drive higher conversions.
Perhaps you’re selling with the highest conversion rate on Amazon, while on Lazada, conversion consistently lags behind. Graas lets you compare performance across all your stores, helping you identify areas for improvement and implement targeted strategies to boost conversions in underperforming locations.
Geo-location allows you to identify a surge in sales for a particular product line in a specific region. This knowledge allows you to create your marketing campaigns and product offerings to cater to regional preferences, maximizing sales opportunities.
You can group your data by various other factors, including customer demographics, purchase history, and product categories. Analyzing your eCommerce data at such a granular level almost guarantees success.
Remember the frustration of filtering data in spreadsheets? Endless formulas, complex criteria, and the constant risk of errors—these are just some of the headaches Graas eliminates.
You’ll be able to sift and filter through heaps of data by specific values in seconds, isolating precisely what you need. Need to calculate the true Gross Merchandise Value (GMV) excluding returned and canceled orders? No problem! Simply filter your data by order status, selecting values like "Delivered," "Dispatched," "Accepted," and "Processing." Graas instantly displays the accurate GMV, saving you hours of tedious work and the potential for errors.
Let's say you want to analyze marketing campaign performance but only for a specific product category. Graas lets you filter your data by both campaign and product category, allowing you to pinpoint the effectiveness of each campaign for different product lines.
Graas allows you to present that data in the format that best suits your needs. It’s a platform filled with different chart types, each offering a unique perspective on your data. You get the ability to preview your chart in various formats like stacked bars, lines, trees, pies, tables, and cards, before selecting the one that delivers the most impactful insights.
Here are the view options available:
With a vast range of chart formats at your disposal, you have the flexibility to build your dashboards to present your data in the most insightful and visually compelling way possible. This allows you to communicate complex information to your team.
Remember the endless email chains and conflicting versions floating around when collaborating on spreadsheets? Graas eliminates this chaos, fostering seamless data sharing and collaboration within your team.
Sure, spreadsheets might be a viable option if you have a limited dataset and just a handful of employees. But as your business grows, so do the complexities of data sharing. Graas steps in as the perfect solution.
With Graas, everyone on your team can access the latest, most accurate data—all in one centralized location. You can create beautiful, informative dashboards within minutes and share them with your colleagues with just a few clicks. Simply give them access levels based on their needs, ensuring data security and preventing unauthorized edits.
The best part? Any changes made to the underlying data are reflected in real time across all shared dashboards. This eliminates confusion and ensures everyone is working with the same information. No more wasted time consolidating data or chasing down the "correct" spreadsheet version.
Stop feeling overwhelmed by spreadsheets and use your eCommerce data to its true potential with Graas custom dashboards. They make your eCommerce data analysis effortless and give clear and actionable insights. The best part is how easily you can collaborate with your team.
Graas offers the flexibility you crave:
Stop settling for spreadsheets. Sell more with Graas custom dashboards. Try our product today!
8 Craig Road, Singapore 089668
Email: info@graas.ai
ติดตามเราได้บน LinkedIn